Experience the power of Luzmo. Talk to our product experts for a guided demo or get your hands dirty with a free 10-day trial.


January 4, 2023
Mieke Houbrechts
Is your data model optimized for offering reports and analytics to your SaaS product users? Here are the 10 steps you need to build a successful data model.
Building a data model for your SaaS business is no joke. A simple data model has many benefits, but it can easily become a monster of Frankenstein. Even under the guiding eye of the best product and engineering teams. Here is a 10-step process to build a data model that answers business needs. Without all the complexity.
First, ask yourself why you are starting a data modeling project. Your organization may need a new or improved data model for many reasons, to name a few.
The requirements for your data model will depend on what you want to use it for. Without a clear objective, it’s impossible to make the right decisions.
The process of this article works for any of these objectives. However, we will focus on the last scenario: building a data model for customer-facing reports in SaaS applications.
The best teams for a data modeling project are cross-functional, without having too many chefs in the kitchen.
For SaaS product teams, a well-balanced data model squad could look like this.
For a data model to be successful, you need input from subject matter experts who will be using the data model. In SaaS product teams, this can be a client-facing colleague, e.g. customer success, account manager,…
💡Pro tip: involve a product user or ambassador to consider the final user’s point of view.
This person knows how all your systems and data sources link up. The usual suspects for this role are the following.
This expert role will help keep the model simple. Typically your database owner, data scientist or (data) engineer can best assess how to trade off the complexity of ETL processing with simplicity and predictability.
Poor communication and a lack of consensus are often the root cause of complex data models. Product managers are crucial moderators. They will work closely with all stakeholders and agree on the business rules and definitions. This person will also define and align the KPIs and metrics for the data model.
With this agile, yet balanced team, you’ll ensure faster progress.
💡 Tip: If you don’t have data modeling expertise in-house, it pays off to hire an external consultant. Are you using data modeling tools or embedded analytics software? Many vendors offer professional services to fill the knowledge gap.
Start building a roadmap for your project with clear timelines and deliverables. A data modeling project typically has two phases.
In theory, you will only need to outline your business processes once. If necessary, you can always revisit and make adjustments.
Designing a data model, however, is a repeatable process. Repeat steps 6 to 10 for each of your customer’s business processes. Agility guaranteed!
It takes 3 to 4 weeks to design a single business process — or a group of tightly related processes. Remember this when planning your design sessions.
The first step in your data modeling process is to agree on the business questions addressed. You can gather business requirements within your squad in many ways.
Below, you will find 4 simple steps to outline all the business processes of your customers. These definitions will be the basis for your conceptual data model.
Business processes are operational activities. For example, taking an order, processing a claim, registering students for a class, etc.
A good tip is to focus on business outcomes, for example:
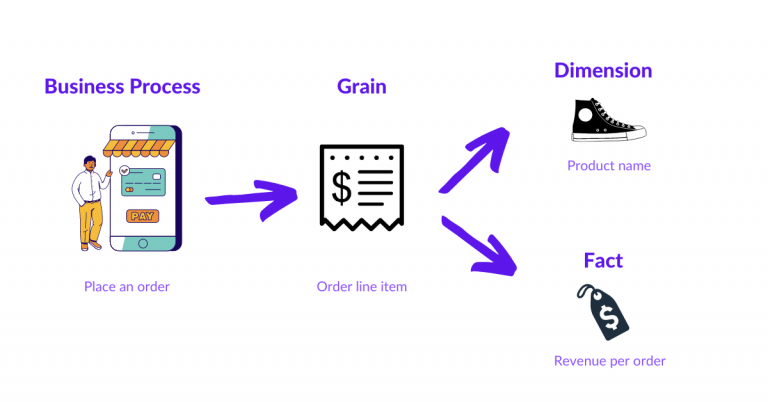
In your final data model, a fact table will represent one single business process.
The grain is the most atomic level of insight a business user cares about. It’s impossible to predict what each user needs precisely. So, a good data model will support the lowest level of information possible.
In your final data model, the grain will become a single row of your fact tables. Let’s exemplify what the grain could look like for the business process of placing an order.
❌ One row per individual order placed
✅ One row per line item on a person’s order
With every line item included as a separate row, your customers can do a richer analysis if required.
⚠️ This is the most critical data modeling step because your entire design depends on the grain of the fact table. Keeping the grain on the lowest level ensures that your data model supports slicing and dicing across all relevant dimensions and measures, while also making sure it can be easily scaled out in the future!
Dimensions give descriptive context to the business process. Imagine this as the who, what, where, when, why and how.
In your final data model, every dimension will be represented in a separate dimension table to give more context to your facts. For placing an order, dimensions could be the product name, customer name, purchase date, etc.
Facts are numeric, additive figures. They are a measurement or metric of your business processes. If your business process is “processing a claim”, facts could be
The Business Matrix is a great planning tool for Product Managers to keep oversight. This tool maps how your business processes relate to common dimensions. It’s a simplified version of your conceptual design.
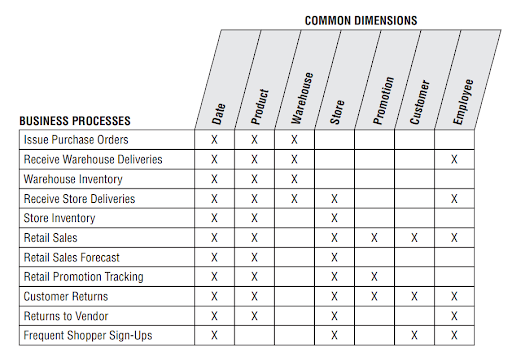
As you dig deeper into the business processes, you may discover new relationships. When that happens, your business matrix will keep the design process organized.
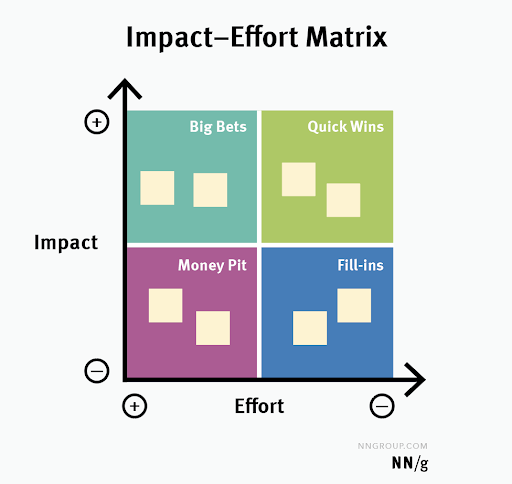
In the previous step, you identified all your business processes. You will need to go through the data modeling process for each one separately. To keep your model simple, prioritizing the right processes is essential.
Evaluate all your customer’s business processes from step 4 on two axes.
Start with the low-hanging fruit – high impact, low effort – and work your way down.
Once you defined and agreed on the business processes and their prioritization, you can start building a conceptual data model for the first business process. Consider this an ugly first draft of your desired data model.
Instead of immediately building the model in your database, sketch it out in business terms first.
With the outlined business process from step 4, you can now map the model onto a high-level bubble chart. Don’t pass this task to an experienced designer. Instead, engage your entire squad in this process. Your model will be clearer and more understandable for your customers.

The following tools can help you with the data model design.
For the first mock-up of your data model, a simple spreadsheet will do. They’re quick and easy to iterate on a flat conceptual model.
Later on, data modeling tools are helpful in turning your draft into a dimensional model. Database administrators can forward-engineer the model into the database. This is where you’ll create tables, indexes, partitions, views, etc.
Data profiling tools help you get a better understanding of your data entities. For each attribute or column, you’ll be able to define
With data profiling tools, you won’t rely on outdated or incomplete documentation. With a few simple SQL statements, you can query your source systems to find actual content and relationships.
Usually, you’ll be able to do data profiling within any major ETL tool.
Naming conventions are a must to keep your data model simple. Label each element descriptively and consistently.
Below is a common label structure you can reuse.
The resulting label would be “Contract Start Date”.
Most of your strategic work is now done. You have defined, mapped out and agreed on all the elements of your data model.
Now, your technical team members can finally develop the data model. However, you’ll want to keep your business reps engaged during that process. Their feedback will ensure that customers understand the data model and want to use it.
Design sessions work best in blocks of 2 or 3 hours, 3 or 4 days per week. We recommend mixing morning and afternoon sessions. As such, your designers and modelers will have enough time in between to prepare or finish tasks that might otherwise block the other.
Here are a few tips for smooth design sessions.
Your data model is almost ready for use! We recommend a thorough review and validation with your core stakeholders.
Let IT review first, because they know the system that runs the business processes of your data model. IT can review fact and dimension worksheets, as well as resolve any open issues.
When you validated the tech, it’s time to test your model with product users who will use the data model. Make sure to test it with power users first. They will assess your data model with much more detail and accuracy than any other user.
Finally, a review with broader business users will truly validate your data model. Illustrate how the model supports their business requirements. Walk them through some examples of real user questions and scenarios.
For the broader user review, you can target users who won’t use the data model right away, but might adopt it in the future.
With these finishing touches, your data model is well-documented and ready for use.
As mentioned before, each business process needs a separate data model. Repeat steps 6 to 9 for all the business processes you’ve outlined in steps 4 and 5.
And that’s it!
…
Well, almost.
Data modeling is only the beginning. Now, your team can start building client-facing dashboards for your product users. Or you can even expose your datasets and let customers build their own dashboards. This experiment will really put your data models to the test.
With a simple, yet powerful data model, the world is your oyster!
Do you need to build out these data visualizations faster with fewer resources? Then embedded analytics software is a great choice. Whether you’re starting out or optimizing your current data stack, our team of experts is here to help. Book a consultation and get expert advice today.
Experience the power of Luzmo. Talk to our product experts for a guided demo or get your hands dirty with a free 10-day trial.


