Experience the power of Luzmo. Talk to our product experts for a guided demo or get your hands dirty with a free 10-day trial.


October 11, 2023
Mile Zivkovic
Javascript chart libraries are one of the most effective ways to do data visualization in your app. But what if there is something better that SaaS teams can use?
Javascript chart libraries are one of the most effective ways to do data visualization in your app. But what if there is something better that SaaS teams can use?
There are a lot of moving parts to an app and at the heart of it all is data. And if your app has customer-facing data, you probably know that understanding pie charts and graphs is a lot easier than reading rows and columns of numbers.
This is where data visualization comes in. There are a few ways to visualize data in your app or website, but your developers probably use Javascript chart libraries.
Today, we’ll find out what they are, what you can use them for and what is a better alternative for the job.
A Javascript chart library is a type of Javascript code that allows development teams to visualize data in the form of charts. Back in the day, a programmer had to collect data from different types of databases to create charts and dashboards that provide valuable data. Nowadays, you can use a chart library to get data from various sources in one place.
The most common use case for chart libraries is creating visualizations within an app. For example, a dashboard in a social media scheduling tool showing post engagement across different channels.
Different types of chart libraries allow different types of visualizations. Here is a neat comparison of Javascript chart libraries along with what they can and cannot do. For example, some can do line charts and bullets but not timeline charts.
Depending on the dataset you need to visualize, you’ll choose different chart types that works best for that use case.
If you’re just getting started with data visualization, these are the chart libraries you should consider first.
The most commonly used chart library is popular for a good reason. The API that D3.js uses is powerful and it works with various formats such as CSS, SVG, and HTML. There are plenty of samples you can use to learn from, which you will need to do, as D3.js can be pretty complex for newbie developers with no experience with DOM. It’s also free.
Chart.js is open-source and completely free to use. It supports eight different types of data visualizations, including pie charts, inline charts, radars, area charts, and many others. The learning curve is not steep with this JS library and there is detailed documentation to help you in your chart creation process.
And if you use the various available plugins, you can get even more out of Chart.js.

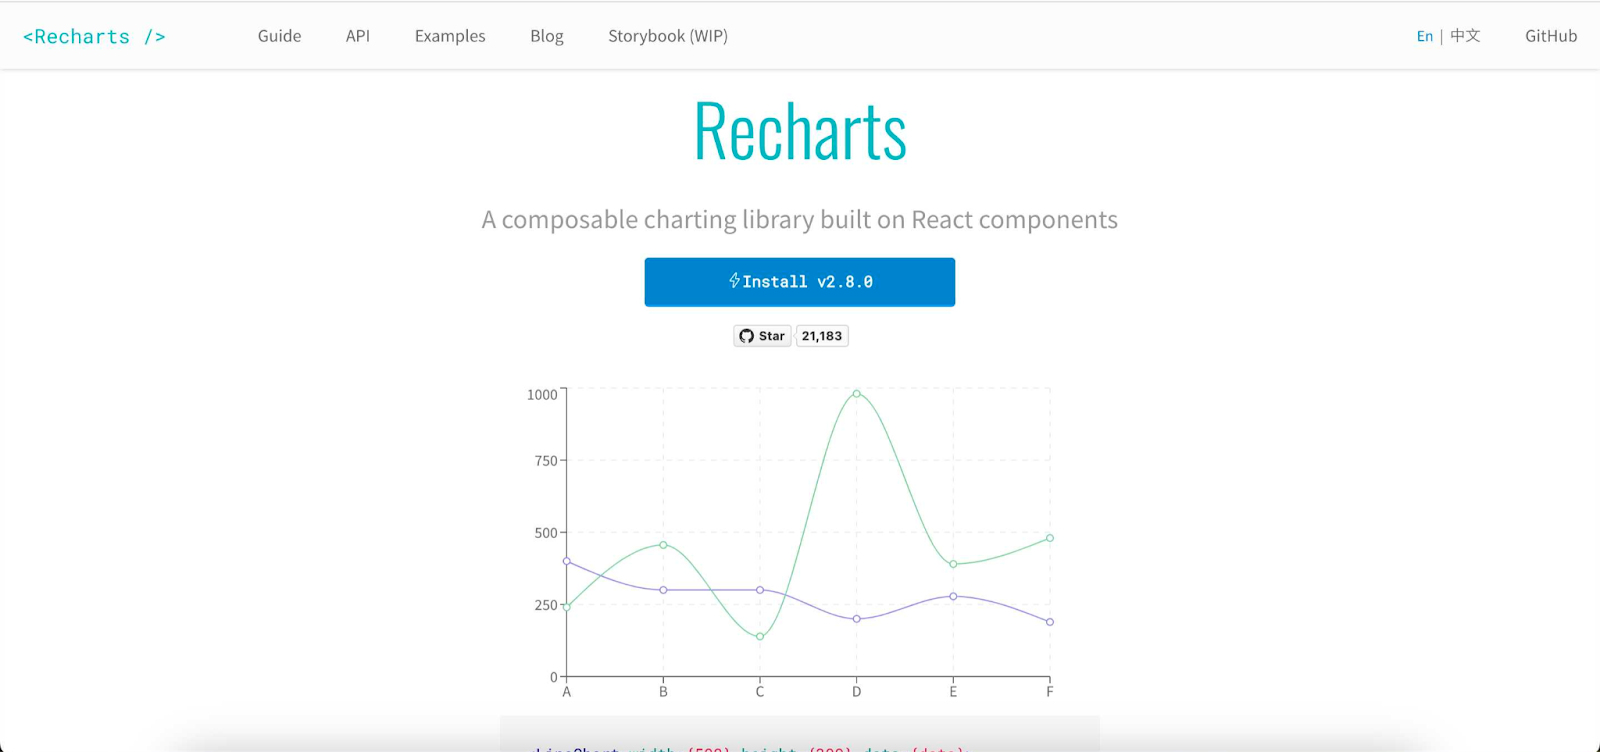
Recharts is a composable chart library built on top of React components. To build charts, you can use SVG elements on top of a D3 submodule. It allows ample opportunities for modification, which is one of the reasons it’s used globally by companies such as Ahrefs.
While it can be a bit slow when working with large data sets, it more than makes up for it with its customization capabilities and ease of use.
PS. Make sure to check out our piece on React dashboard libraries.
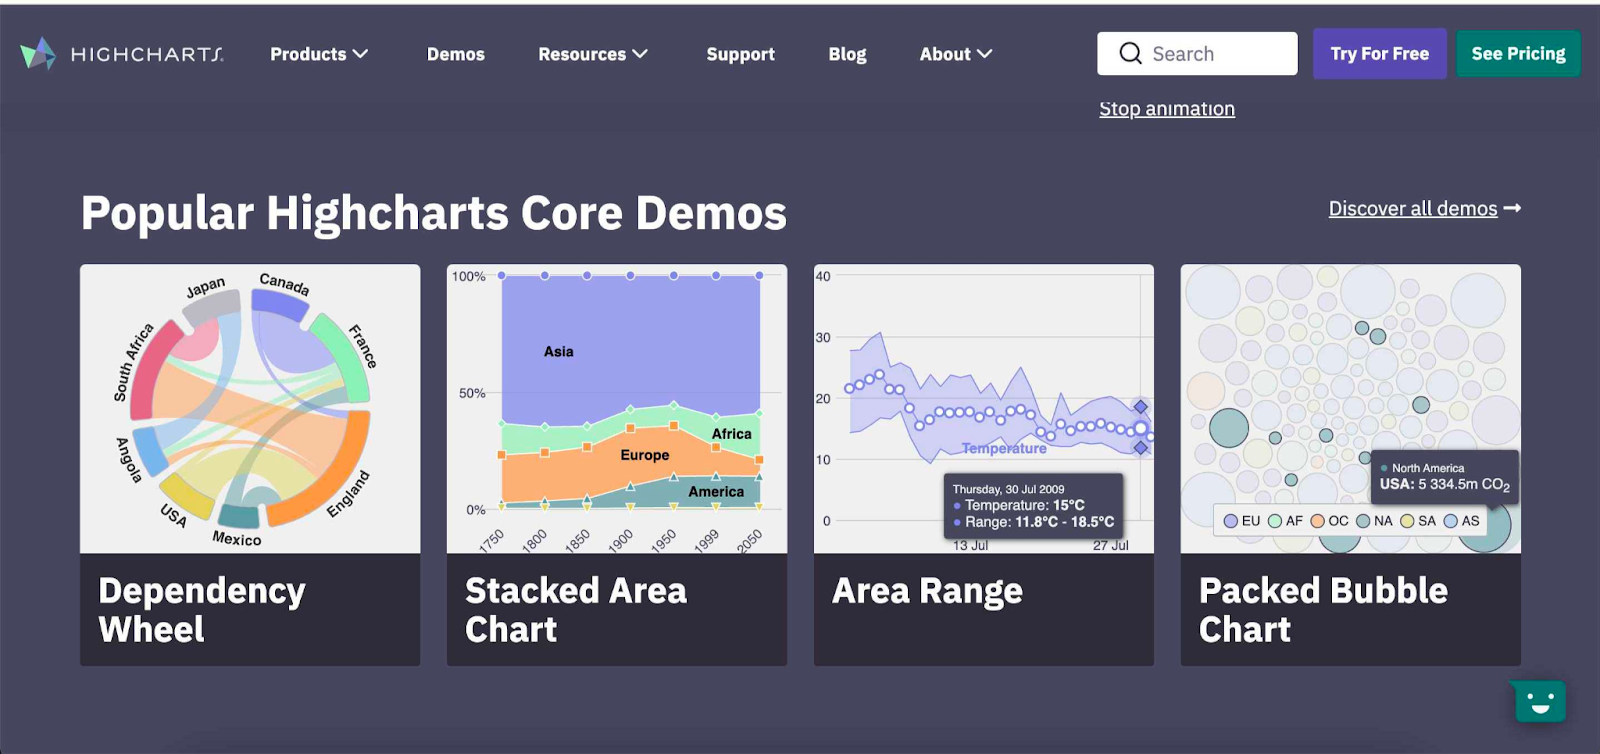
Highcharts allows you to create charts in SVG and then convert them to VML. While their motto is “simply visualize”, the way the dashboards look is not exactly impressive compared to some other contenders. However, the backward compatibility with older IE versions as well as the wide variety of demos make it an interesting choice.
If you’re handy with Javascript, this library will be extremely simple to master. On top of the ease of use, there is a very rich documentation library that can help you get started rapidly.
Looking for something that is open-source, easy to use, has beautiful visualizations and allows annotations? Apexcharts has you covered. According to their documentation, this library supports all charting features, including annotations, which are not so common among its competitors.
Besides charts, Apexcharts has a separate product called Reveal, which allows you to do embedded analytics and add charts into your website or product. Apexcharts supports Angular, Vue, React and other frameworks.

There is a total of 90 charts that you can use in Fusioncharts, making it the most comprehensive option out there. Besides charts, you can also create dashboards and both look stunning, with interactive animations for the end user.
It supports jQuery, Angular, Django, React, PHP, Net, Ruby and many other types of frameworks.
Fusioncharts work and look great across different devices. All of this comes at a price of $439/year which may be worth it if you need a great variety of visualizations across devices.

If you’re a fan of the Google ecosystem and you’re looking for something free, Google Charts fits the bill perfectly. It supports a good variety of data visualization formats, including scatter plots, geo charts, pie charts, calendar charts, and others. The visualizations look great across different devices and they are rendered using HTML5/SVG.
You can use Google Charts to create bar charts, Gantt charts, donut charts, scatter plots, maps and many other types of JS charts.

Notable mentions: Amcharts, Chartist.js
Before we jump into the bad stuff, let’s consider a few reasons why a Javascript library is a good option for data visualization.
Especially with open-source libraries, there are plenty of communities online (such as GitHub) where you can find support. If you get stuck solving a specific problem, there’s probably someone else that had it before and you can look up a solution quickly or go through tutorials and demos to find out how to do something.
The four libraries mentioned above are just a starting point. With a little bit of research, you can find many more that suit your needs in terms of ease of use and visualizations. As mentioned before, not all chart libraries have all the visualization types, so it’s worth shopping around to find the best one for your development team’s needs.
Even though they are commonly used in development teams of all sizes, these types of libraries are not ideal for everyone.
Using a chart library is a neat shortcut for data visualization, but you still need developers to write the code and embed the visualizations in your website or app. If you don’t already have a great Java developer at hand, you’ll need to hire one (expensive) or get an expert freelancer to help (even more expensive) if you run into front-end or back-end issues.
For example, if you want to add tooltips, annotations or some other complex functionality, you’re going to need professional web development help.
As mentioned above, some Javascript chart libraries are free to grab and use. However, that does not mean that you’ll get them entirely free. When you account for the time to implement them and the hourly wages for your developers, it translates to thousands of dollars in resources. The less your existing team knows about data visualization, the more costly the project gets.
Also, the very best Javascript chart libraries with the most visualizations are not free and have a subscription fee.
Assume you have your data sources all set up and you know that your customers want to have data visualizations in your product. Depending on how big your development team is, it can take weeks and sometimes months to go from an idea to a finished product. Going from data points to interactive charts can be very complex.
If you’re unsure that customers will find data visualization a valuable aspect of your product, you can create something using Javascript chart libraries. In theory, it’s a good idea, but in practice, it can cost weeks and months of work and thousands of dollars in development costs. And in the end, it may prove to be something that customers don’t use at all.
Javacript chart libraries are a great resource for data visualization, if you have a team of skilled developers and time to spare. But what if that is not the case?
With data visualization tools such as Luzmo, you can eliminate all the downsides of a Javascript chart library.

First, Luzmo is fast and allows you to go from prototype to a finished product more quickly - in days instead of months compared to developing your own in-app dashboards. This leads us to our second point.
Luzmo allows you to validate your product ideas quickly and without shipping them fully. There is no need to develop a full-fledged dashboard from scratch. Just build one in Luzmo and gather customer feedback instantly.

Last but not least, you don’t have to use your own developer resources. A single developer can cost upwards of $100k per year - do you want to use those resources on data visualization or another core product feature your customers are asking for?
Building data visualizations with your own team can seem like the only path you can take. However, there is always a choice and you don’t have to resort to using Javascript chart libraries.
Sign up for a free trial of Luzmo and get an alternative to Javascript libraries that saves your time and money, while giving your users real-time insights into their data!
Experience the power of Luzmo. Talk to our product experts for a guided demo or get your hands dirty with a free 10-day trial.


